 Download slides
Freight costs up as supply tightens: 2026 market outlook
Updated: Thursday, August 07, 2025 | 06:00 AM CDT
Onthispage
U.S. spot market
Truckload spot rate forecast for 2025
C.H. Robinson is adjusting the 2025 truckload spot rate forecast downward, with the expected year-over-year (y/y) change moving from +4.0% to +2.0%. This change reflects costs coming in lower than expected after the Memorial Day holiday, not due to any significant change to the outlook for the second half of 2025.
Truckload spot rate forecast for 2026
C.H. Robinson projects U.S. truckload spot rates will rise modestly in 2026, with our model reflecting a y/y increase of approximately 2% for dry van and refrigerated freight. This expectation is shaped primarily by truckload supply factors. To date, there’s little evidence of a catalyst on the horizon that would suggest freight volumes will increase materially next year.
Real U.S. gross domestic product (GDP) has been volatile in 2025 due to large swings in imports and exports and the resulting impact on inventories. When backing out these factors, it’s visible that annualized growth in domestic demand for goods and services has decelerated to 1.5% growth in Q1 2025 and 1.1% growth in Q2 2025 from 3% growth in 2024.
Most of this slowdown can be attributed to lower levels of consumer spending, which is the largest driver of the U.S. economy and also U.S. freight volumes. With imported goods starting to reflect higher prices and a slowing of immigration, we don’t expect a material re-acceleration in U.S. growth.
On the supply side, subdued Class 8 tractor orders and the pace of smaller carriers leaving the market indicate that trucking capacity is continuing to rationalize. This dynamic has been especially evident during periods of seasonal stress, such as Road Check Week, when tightening in the spot market drove greater cost volatility than previous years. Continued cost volatility around these events is expected to continue, due to the reduction in carrier supply.
The primary driver of the increase in the 2026 forecast is the ongoing inflation in the cost to operate a truck. The recently released American Transportation Research Institute (ATRI) survey shows an increase of almost 4% in truckload operating costs in 2024 y/y, excluding fuel. This 4% increase is layered on top of a three-year operating cost inflation stack of 25%.
In addition, the ATRI survey indicates the inflation has continued into 2025, with Q1 2025 up nearly 2% compared to the full year 2024. ATRI's 2025 preview data as well as our carrier surveys show this trend is persisting. While broader inflation increases, the higher cost to operate a truck will be even more impactful as more capacity exits the market.
For shippers, this means the truckload market may remain generally balanced between supply and demand, but carrier cost pressures are likely to exert steady upward influence on rates—especially during periods of disruptions. Significant shifts in economic conditions, trade policy, or carrier supply could change these expectations and our 2026 forecast. Going into RFP season and 2026 planning, connect with a C.H. Robinson representative to assist you with scenario planning.
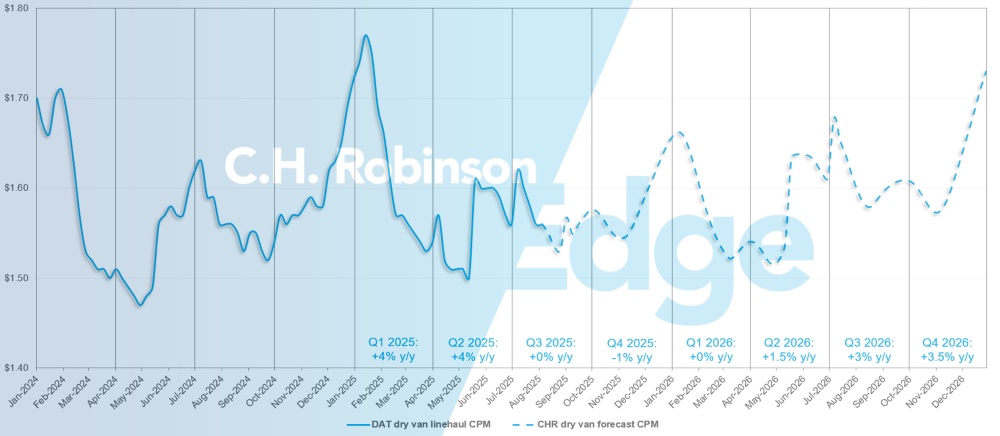
U.S. spot market forecast: Dry van truckload
The C.H. Robinson 2025 dry van cost-per-mile forecast has been cut to +2% y/y, while the 2026 forecast is released at +2% y/y.
C.H. Robinson spot market dry van truckload forecast
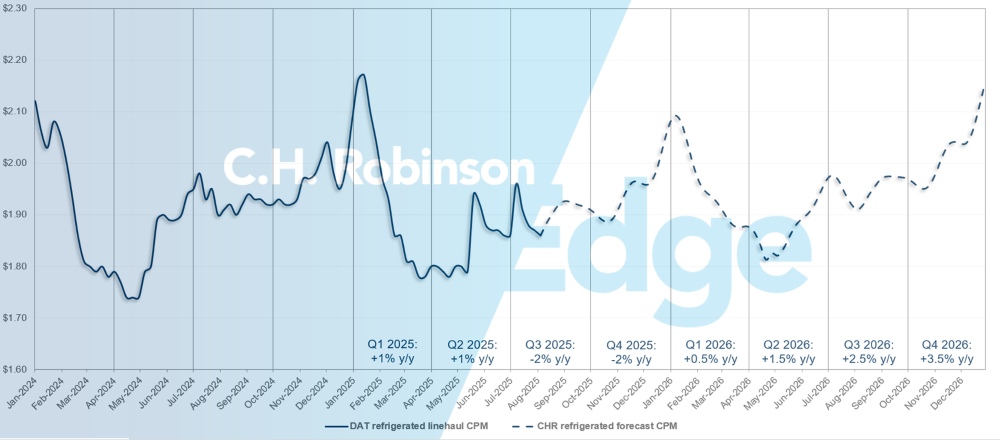
U.S. spot market forecast: Refrigerated truckload
The C.H. Robinson 2025 refrigerated van cost-per-mile forecast has been slightly decreased to -1% y/y, while the 2026 forecast is released at +2% y/y.
C.H. Robinson spot market refrigerated truckload forecast
For-hire carrier forecast
If the current pace of U.S. carrier attrition continues, the number of carriers with authority to operate would return to a historical level in early 2026, possibly later.
C.H. Robinson for-hire carrier forecast
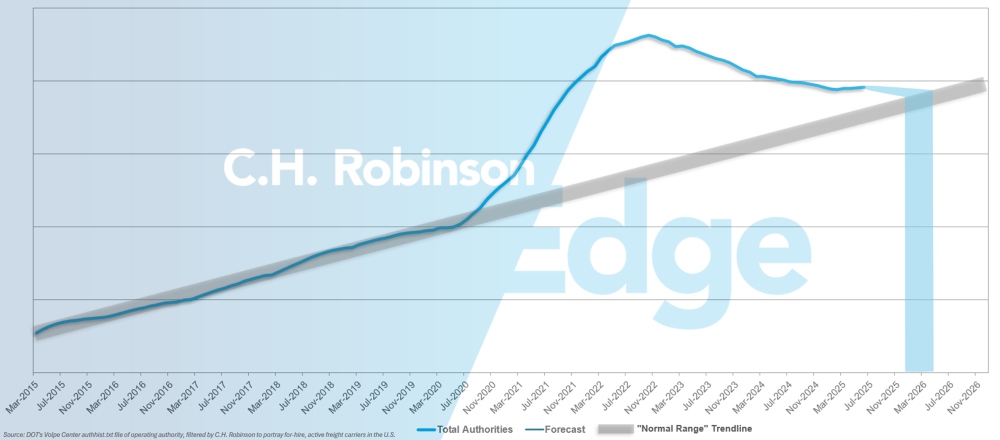
The number of carriers with authority retreated again in June, after a slight rise in May due to a temporary seasonal volume increase. Further carrier attrition at low levels is expected in the coming months.
Contract truckload environment
The following insights are derived from C.H. Robinson Managed Solutions™, which serves a large portfolio of customers across diverse industries.
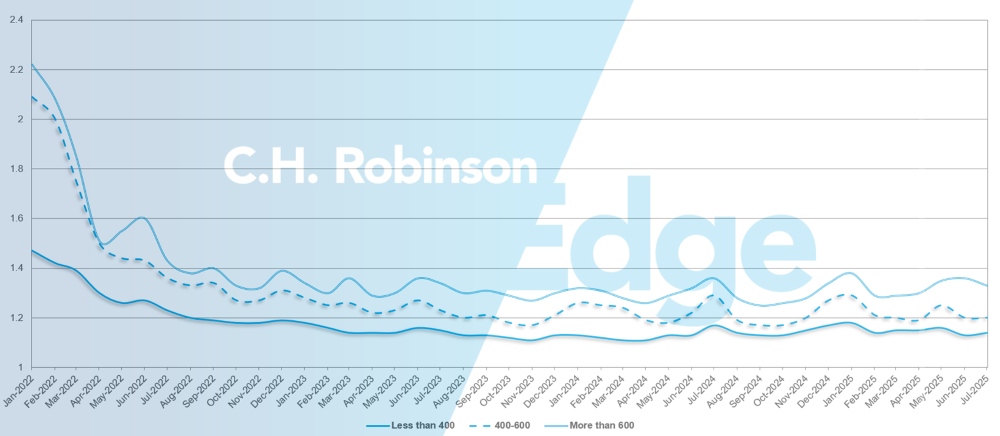
Route guide depth is an indicator of how far a shipper needs to go into their backup strategies when awarded transportation providers reject a tender. 1 would be perfect performance and 2 would be extremely poor. As displayed in the following chart, it has remained flat at a historically low level for approximately three years.
For the month of July, route guide depth across all U.S. regions and shipments was 1.2, a slight improvement compared to the previous month of 1.21.
From a mileage perspective, long hauls of more than 600 miles had a route guide depth of 1.33 in July—better than the 1.35 the previous month and the 1.35 in July 2024.
For shorter hauls of less than 400 miles, route guide depth for July 2025 was 1.14, which is slightly worse than the previous month of 1.13 but better than July 2024 at 1.16.
North America Route Guide Depth Metrics: Miles
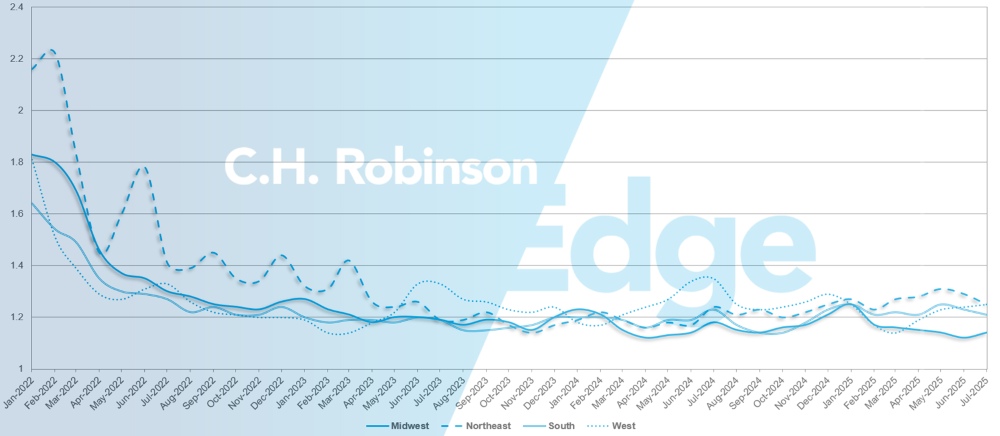
Geographically, the West experienced the smallest change of all regions, worsening by 1% from the previous month, while the Northeast experienced the largest change, improving by 3.3%. Route guide depth still remains at low levels between 1.14 and 1.25 for all U.S. regions.
U.S. Route Guide Depth Metrics: Regions
Refrigerated truckload
East Coast United States
The outbound Southeast refrigerated market remains soft, with ample capacity readily available. Freight destined for Florida is currently the most challenging, due to the limited outbound volume from the state.
The Northeast market is also soft overall, though a notable uptick in freight activity out of Massachusetts has created some tension. If possible, add lead time when planning shipments out of or near Massachusetts to secure the best pricing.
Central United States
The Midwest market remains relatively stable, with capacity widely available and just rate dependent. A recent uptick in freight activity across Indiana and Michigan has been observed, and carriers have been prioritizing the most basic, straightforward shipments first.
Out of Missouri and Arkansas, same-day capacity remains tight, though availability improves with advance notice. Outbound Dallas freight has experienced intermittent pockets of tightness, but overall, it's a rate-versus-capacity dynamic. Freight with a single pickup and delivery is moving efficiently and at the most competitive rates. South Texas continues to show steady capacity with minimal disruptions.
These trends are expected to hold through Labor Day and into Q4 2025, with the only anticipated disruption being the holiday weekend itself. Additionally, rates for freight headed to the Southeast are increasing, as carrier interest in that direction is now limited.
West Coast United States
Recent seasonal transitions in West Coast commodities have begun to shift freight market dynamics. In Washington, the cherry season is expected to conclude in early August, which should ease some transactional capacity constraints and create a brief lull in the market ahead of apple season in September.
Grape shipments out of Arizona have transitioned to California. This has resulted in higher costs inbound to Arizona, due to less freight for carriers to get a return load. Conversely, outbound rates from Arizona have declined. California has seen elevated costs on short-haul loads, particularly those booked with little lead time, as well as on shipments destined for the Pacific Northwest and Arizona, although capacity remains accessible.
This month, long-haul freight costs from the West going to the Southeast are expected to rise due to the seasonal lack of freight available down there, while rates into the Midwest and Northeast continue to stabilize or slightly decrease.
Flatbed truckload
Pockets of tight flatbed capacity are expected to persist through late summer, but the broader market is gradually stabilizing.
Conditions followed seasonal patterns in July, with the national load-to-truck ratio easing after peaking in May and June. The market began to normalize after the Fourth of July holiday, though isolated regions have experienced short-term volatility, especially areas with concentrated project freight or lingering weather impacts.
Spot market volumes remain well above 2024 levels but have moderated since the early spring surge, much of which was driven by shipping activity ahead of U.S. tariff increases. With that surge fading and peak construction freight tapering off, the higher flatbed spot rates from earlier this year are unlikely to persist.
Since the Federal Reserve recently announced the interest rate target will stay at 4.25%–4.50% to combat inflation, that also means capital investments are unlikely to meaningfully increase and higher demand for building materials and manufacturing is not imminent. As peak hurricane season approaches, there is a risk of storm damage, which would require a surge in building materials. A sudden, sharp, and localized increase in demand could tip the scales back toward higher flatbed rates again.
As noted in the July C.H. Robinson Freight Market Update, hurricane season is expected to peak in early-to-mid-September. Having a plan before a storm is on the horizon is highly recommended for shippers moving freight into or out of the East and Gulf Coast states.
To stay ahead, many shippers are focusing on three key strategies: extending lead times, securing capacity early to capture competitive pricing, and staying flexible by utilizing all compatible equipment types their freight can safely move on. One powerful resource is the C.H. Robinson Supply Chain Inspection Report—an effective way to uncover inefficiencies, validate routing strategies, and reduce exposure to hidden costs. Even in a softening market, these practical steps help drive savings and ensure service stability.
Voice of the carrier
Observations from a cross-section of the 450,000 contract carriers in the C.H. Robinson network:
Market
- Overall rates seem to be entering a stable pattern, following seasonal expectations.
- Some carriers are looking to reconcile lanes to optimize volume that fits best into their networks.
Drivers
- Drivers are plentiful, but carriers are still prioritizing the highest quality drivers.
- Stricter enforcement of the English language proficiency regulation for drivers in the United States is not having a meaningful impact.
Equipment
- Multiple carriers described decreasing the size of their fleet to increase cash flow. They are removing more generic equipment, like dry van trailers, resulting in more specialization.
 Actionable freight insights